Charting a Course – Chapter 5: A Price on Water Use by the Natural Resource Sectors
The previous chapter discusses the potential of EIs and voluntary initiatives to move industrial and agricultural water users toward greater efficiency and conservation. In researching these policy tools, the NRTEE identified a lack of information on water pricing in Canada, specifically on the potential for volumetric water pricing. We therefore conducted new and innovative research to determine the potential of water pricing to deliver on our two goals of improved water efficiency and improved water conservation. 35
We find that water pricing applied to the intake of self-supplied water in the natural resource sector may deliver water-use reductions thorough efficiency and conservation gains at costs that may be minimal. Water prices afford a significant opportunity to reinforce water-efficiency gains observed in Chapter 3. Of course, there will be cost impacts on industry, ranging from small to large depending on the sector. But for all sectors, costs rise quickly as greater water-use reductions are sought. In this chapter we present the approach and methods used to reach these conclusions, as well as detailed modelling results.
To explain our findings we start with a discussion of the price currently paid by industry for water intake and follow it by examining potential water-use reductions that could be realized from pricing water. We then look at related cost implications to sectors and the economy.
THE CURRENT PRICE OF WATER
A key starting point for assessing the potential of water pricing is to determine the costs that industry currently pays for water intake and use. Outside of industry there is a perception that water is free. In reality, the use of water has costs associated with it, which vary across the country and between sectors. The total cost of using water includes components of what is paid in licensing fees to provincial governments as well as intake, recirculation, and discharge costs that require energy, labour, and capital.
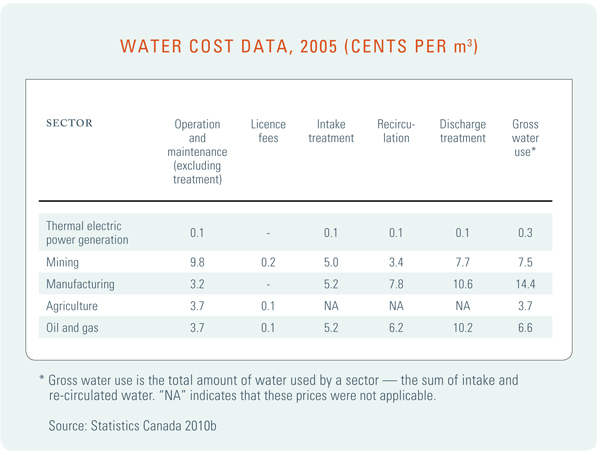
Statistics Canada’s Industrial Water Survey collects water-cost data from the thermal electric power generation, mining, and manufacturing sectors. Water intake, recirculation, and operation and maintenance costs for pumping and treating intake, recirculation, and discharge water in 2005 are all publicly available. But some limitations exist that we needed to address, notably a lack of cost information for the agriculture and oil and gas sectors. Discussions with the agriculture sector confirmed that the costs for treating intake, recirculation, or discharge water were zero, with only pumping having applicable costs. For oil and gas, we used a simplified assumption based on the average cost to the mining and manufacturing sectors, but appropriately scaled to production. Table 5 presents the Statistics Canada water-cost data, where the average cost of gross water use is about $0.13 per m3 across all natural resource sectors. This average cost of self-supply is 75% lower than the cost paid by some industries for water from public utilities — $0.53 per m3 versus self-supplied water at $0.13 per m3.
One factor missing in the Statistics Canada data is that of capital costs, or the cost to buy and upgrade equipment necessary for treating and pumping water. Table 5 therefore represents an underestimation of the costs paid by industry for water use. To address this omission we conducted research to fill the gap and added capital costs to Statistics Canada data of the operational costs of water* and incorporated this into the model.
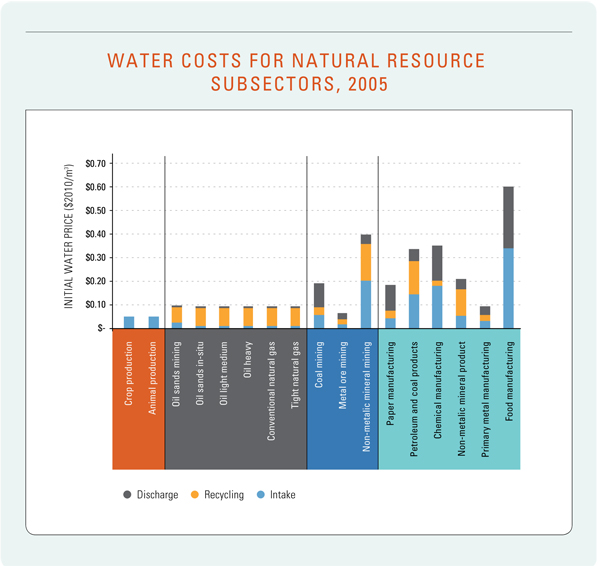
It is important to look at water-use costs by sub-sector of an industry. Current water-use costs vary significantly by subsector (Figure 17) with costs ranging from a low of $0.05 in animal and crop production to a high of approximately $0.60 in food manufacturing. Typically water intake costs are a small share of total water-use costs, with recirculation driving a large share of costs. In some industries like food manufacturing, the need for clean water and effluent-quality requirements drives up intake and discharge costs.†
* See MKJA, 2011 for full explanation.
† Data limitation and confidentiality requirements did not allow for a regional disaggregation of the data by sector, which we expect varies significantly.
TABLE 5
This data highlights that industry does indeed pay to use water: it is not a free commodity. While water-licensing fees account for less than 1% of the total cost, water use represents a real operational cost to industry. Evidence that industry faces water costs likely explains why we have seen improved water efficiency trends of the level presented in Chapter 3.
Having established the base cost of water across sectors, the next section discusses our modelling to assess the potential of water pricing to improve efficiency and conservation.
FIGURE 17
THE POTENTIAL OF WATER PRICING TO IMPROVE EFFICIENCY AND CONSERVATION
The NRTEE used a macroeconomic model of the Canadian economy to assess the potential of water pricing to improve water-use efficiency and conservation and to estimate the impact of the pricing on industry.* In the model, we focus on 2030 as the forecast year, growing the structure of the Canadian economy in 2005 by the same long-term economic forecast used in Chapter 3.† The water-use intensities discussed in Chapter 3 are also added to the model to develop the 2030 water use in each sector. The cost imposed on a sector by a policy such as water pricing depends on the ability of the processes and technology to adapt to this policy. Estimates were acquired and used in the model to assess the percentage change in water demand associated with water-price increases.
* See Appendix 3 for explanation of the CGE model.
† The data underlying the model are derived primarily from the Statistics Canada System of National Accounts (2005) while the forecast is from Informetrica (2011), CAPP’s (2010) production data for oil and gas production, and CIMS energy economy model for electricity production (MKJA, 2011).
WATER INTAKE REDUCTIONS
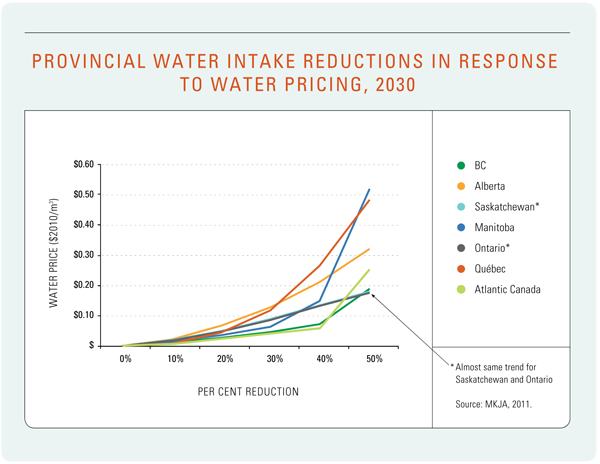
With the model populated with economic and water-use data in 2030, as well as an understanding of how water-use demand responds to water pricing, water-pricing scenarios were applied to see what potential water-intake reductions could be achieved. A series of volumetric charges based on per metre cubed of intake water were imposed on self-supplied water in the natural resource sectors to deliver a reduction in water intake of 10%, 20%, 30%, 40% and 50% in each province. The pricing scheme is applied at the provincial level, and does not equilibrate prices between different provinces. As a result, we allow the water price in one province to deviate from that in another. This pricing regime was chosen because water use is a regional issue more than a national one. The volumetric charges are incremental to the baseline water costs already facing industry, as presented in Table 5.
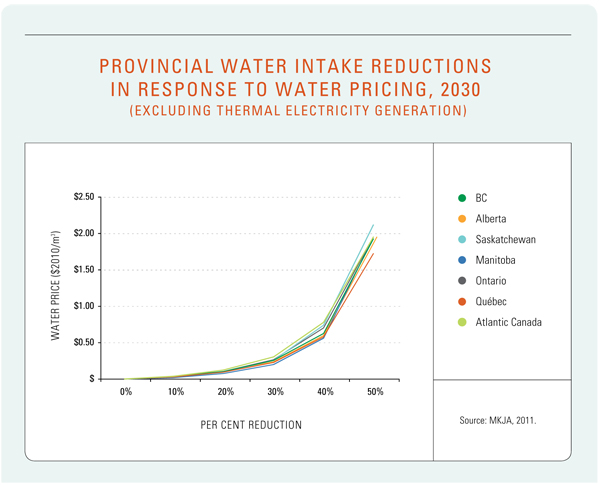
Figure 18 indicates that, in most provinces, a 20% reduction in water intake results from an average price increase of about $0.05 per m3. A 40% reduction in water intake is achieved through the application of a water-intake price averaging $0.14 per m3 with a range from $0.07 to $0.26 per m3.
FIGURE 18
Two variables affect the response of a sector and province to a water price: the initial cost and the ease at which production can be altered in response to cost increases. Sectors with lower starting water prices and a greater ability to change production techniques can reduce their water use at a lower cost than sectors with higher prices or less of an ability to alter production. For example, prices in Québec and Manitoba must rise much more to reach equivalent waterintake goals in comparison with the other provinces, due to the relative shares of their sectors. In Québec the price is higher due in large part to a large manufacturing sector, dominated by pulp and paper that has a low ability to alter water use at a low cost. The manufacturing sector generally has a higher water cost, making reductions in water use more costly. In Manitoba, approximately 75% of water use is in sectors that have a limited ability to alter production — agriculture and thermal electric power generation — which also makes reducing water use more costly. Similarly, 85% of water use in Alberta is attributed to thermal electricity. Although the price of water in the electricity sector is very low, there is a limited ability to use less water.
Because of the insensitivity of thermal electricity use to water pricing and its dominance in total water use, a series of scenarios were developed that remove thermal electricity generation from the calculations. When thermal electricity is removed from the analysis, the overall cost per unit to firms of self-supplied water use — before adding a commodity price — rises from $0.05 to $0.15 per gross m3 (Figure 19). Without the thermal electricity sector included, cost curves for all provinces are quite similar, and the response of each province to water pricing is more uniform. To achieve a 20% reduction in water intake requires an increase in price of $0.09 per m3. To achieve a 40% reduction in water intake requires an increase in price ranging from $0.50 to $0.70 per m3 by province, with an average of $0.55 per m3.
For the remainder of this report, we focus on pricing scenarios that exclude the thermal electricity generation sector because of uncertainty (resulting from lack of empirical studies) of how the sector responds to changes in the price of water.
FIGURE 19
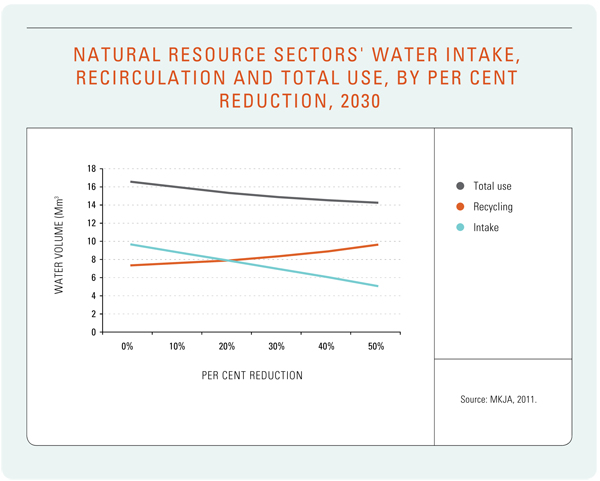
In our assessment we found evidence of both conservation and efficiency in response to water pricing. Because the model allows for substitution between water intake and recirculation, our findings show that with pricing, water intake falls while recirculation increases (Figure 20). However, the increase in recirculation only partially makes up for the fall in intake, such that total water use falls in the pricing scenarios.
FIGURE 20
INNOVATIVE RECYCLING OF WASTEWATER
In 2010, Shell Canada and the City of Dawson Creek, B.C., came up with an innovative solution to the city’s water shortage. Due to water shortages, the city was forced to restrict water availability — creating a problem for Shell, a company that used upward of 25% of the community’s potable water. To ease pressures on the city’s water supply, Shell invested in a new wastewater treatment plant that will produce reclaimed water, supplying Shell and other industries with the water they need. This will allow the municipality’s potable water supply to be available for public needs and will discontinue sales of potable water for industrial purposes. The reclaimed water will cost industries less than potable water supplies.
With thermal electricity generation removed, we estimate that
-
An increase of price of $0.09 per m3 will reduce water intake by 20% and gross water use by 8%, and
-
An increase of price of $0.55 per m3 will reduce water intake by 40% and gross water use by 14%.
Overall, the reduction in gross water use with water pricing translates into an increase in the efficiency of gross water use by 8% with an increase in water price of $0.09 per m3 and 14% with an increase of $0.55 per m3. This means that conservation contributes an important part of the fall in total intake. A key finding is that industry is responsive to the price of water, and efficiency and conservation gains can be expected with small increases in the price of water.
ECONOMIC IMPACTS
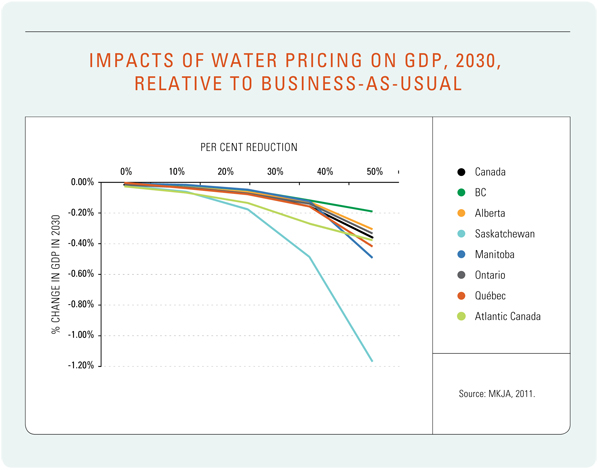
The NRTEE assessed both environmental and economic trade-offs, and as such the water pricing analysis identified economic impacts. A first area of focus is on how gross domestic product (GDP) is affected by water pricing. Overall, economic impacts on Canada resulting from even substantial increases in water prices are likely to be very small. The model suggests a 0.03% reduction in the level (not to be confused with the growth rate) of GDP in 2030 associated with a 20% reduction in water intake in each of the provinces; and a 0.16% reduction in the level of GDP associated with a 40% reduction in water intake. This means that even with the 40% water intake reduction, the economy will continue to grow, and will still be approximately one and a half times larger in 2030. The economic effects of modest increases in the price paid for water appear to be small, affording an opportunity for water users to compensate Canadians for the use of this public resource.
Most provinces do not deviate substantially from the national pattern, although Saskatchewan’s gross domestic product is projected to drop more with large reductions in water use. For a 40% reduction in water use, we project a 0.6% reduction in the level of 2030 gross domestic product in Saskatchewan (Figure 21). This results primarily from the pattern of trade in Saskatchewan, especially for non-metal mineral products (potash and uranium). These products constitute a substantial portion of Saskatchewan’s economic output, and all production is exported such that the demand curve facing Saskatchewan producers of non-metal minerals is essentially flat. When production costs increase with water production, the entire incidence of the policy is borne by producers, resulting in a cut in production. This is in contrast to most goods, for which at least a proportion of production is devoted to local consumption where consumers bear a portion of the burden on the policy in the form of higher consumer prices.
FIGURE 21
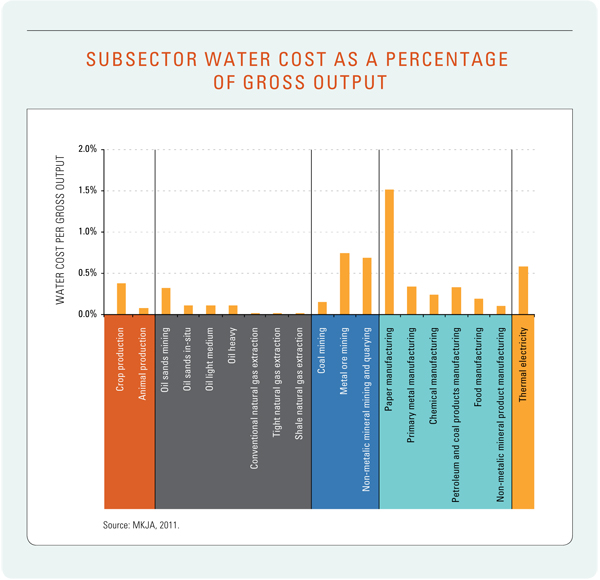
The second area we investigated was the potential impact that pricing would have on the natural resource sectors. One factor that contributes to the impact is the cost of water per unit of output. Figure 22 shows the cost to firms of self-supplied water (including capital, labour, energy, and material costs) for each sector as a percentage of its gross output. However, while the natural gas sectors have the lowest cost per unit of gross output, the cost of water to most sectors is less than 0.5% of their overall gross output. In comparison, the sectors included in this study will pay 15% of their output for energy and 44% for other intermediate inputs. The cost of water makes up more than 0.5% in just four sectors: paper manufacturing (1.9%), metal ore mining (0.9%), non-metallic mineral mining (0.9%), and thermal electric power generation (0.7%). This indicates a risk that water pricing could lead to adverse competitiveness impacts for some, but not all, sectors.
FIGURE 22
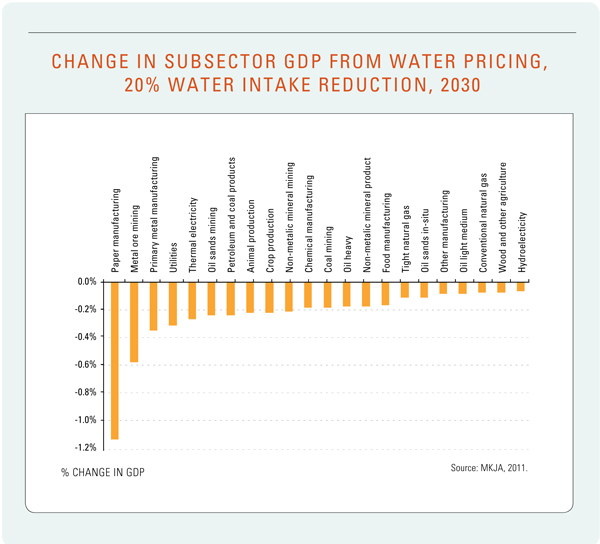
Economic impacts are subsector specific. For example, paper manufacturing, metal ore mining, and non-metallic mineral mining would likely see larger impacts than sectors such as oil and gas. Figure 23 and Figure 24 show changes in gross domestic product by sector (at basic prices*) resulting from water commodity prices.
* Basic prices include all of the costs of capital, labour, and any taxes and subsidies on production. This is consistent with the manner in which Statistics Canada reports on GDP
FIGURE 23
Figure 23 shows changes associated with a 20% reduction in water intake. Several subsectors, including the paper manufacturing, metal ore mining, and primary metal manufacturing sectors experience modest reductions in output due to water pricing. However, in all cases except paper, output losses are less than 0.6% relative to the reference case scenario. In total, as stated above, Canadian gross domestic product is relatively unaffected in this scenario — it is about 0.03% lower than in the reference case.
FIGURE 24
Figure 24 shows the same information for the scenario where water intake is reduced by 40%. In this case, some subsectors experience a more pronounced contraction in output. In particular, the paper manufacturing, crop production, and metal ore mining sectors all experience a loss of at least 2% in gross domestic product relative to the case without additional water charges.
SUMMARY
Our research reveals that the natural resource sectors currently do pay for water use, largely through costs associated with water infrastructure (treatment, movement, and discharge). Our findings show the potential effects of pricing water on achievement of environmental water reduction objectives, with perhaps minimal economic impacts to most sectors and the national economy. A price on water reduces intake by industry resulting in more conservation and better water-use efficiency.
Some industries may be responsive to the price of water, and large efficiency and conservation gains may be achieved with modest increases in the price of water intake. Water recirculation currently plays an important role in water use by many of the industrial sectors, and it appears that water recirculation may have a significant role in future water reductions, as a price on water pushes industries to find innovative ways of using recycled water.
__________________
Footnotes
